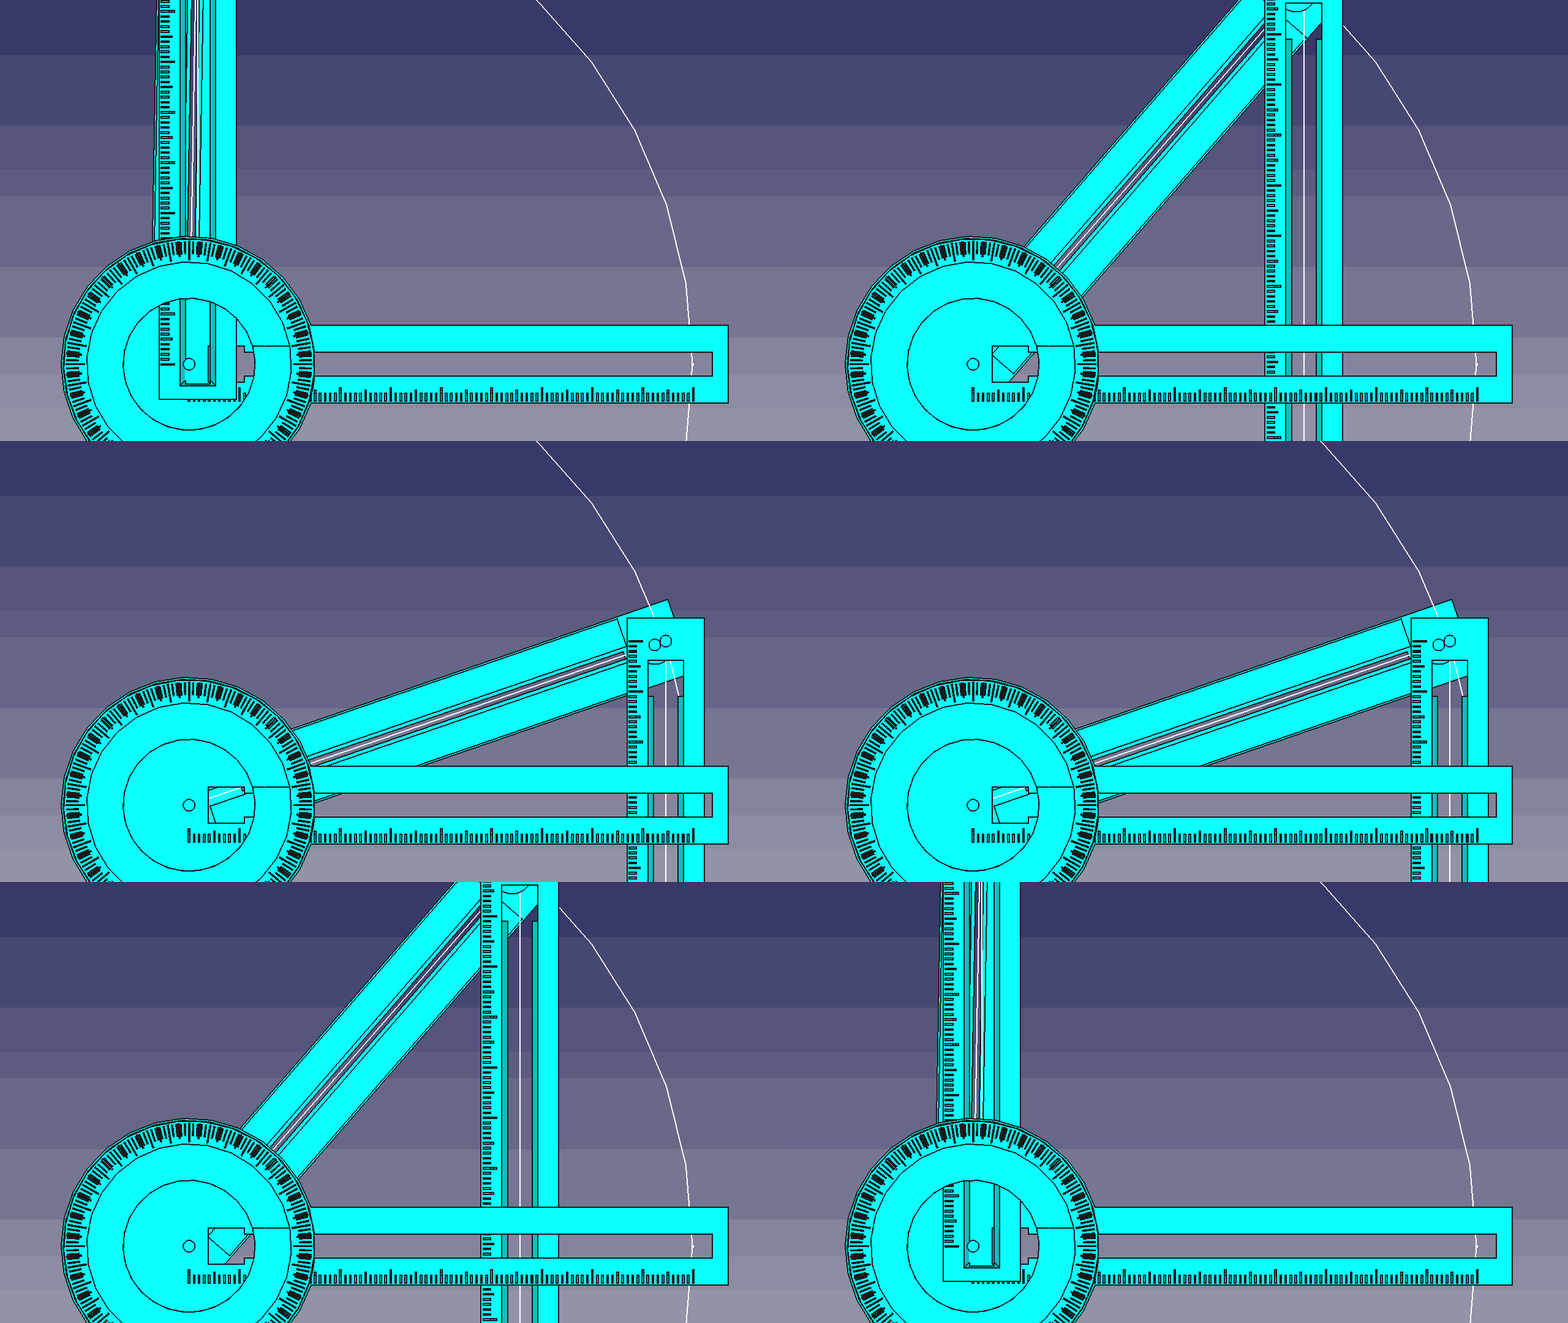
Math & Astronomy Measurement Toolset

A toolset to enhance understanding of Math and Astronomy

Set includes:

  • 3D-Compass
  • Trig-Ruler
  • Elliptic-Leveler
  • Constellation-Overlay
  • Sky-Map
picture.jpg

3D-Compass

Trig-Ruler

picture.jpg

Constellation-Overlay

Elliptic-Leveler


picture.jpg

Our Universe

Are we alone in the universe? We don’t know yet, but we have an idea of how far we need to look to discover the answer. The size of our universe is astronomical but measurable. It would take us nearly 15 to 20 billion years to travel from one end to the other. Along the way we would find 100s of billions of galaxies, each having 100s of billions of stars, and each surrounded by many planets. To do this, we have to travel with the maximum possible speed: the speed of light, and we might just find a planet that has a climate just like on earth. (A light year is the distance light travels in one Earth year. This is almost 6,000,000,000,000 (6 trillion) miles!)
The universe is expanding for now, like a cake rising, and think of galaxies moving away as raisins in the cake moving further apart. The galaxies outside of our own are moving away from us, and the ones that are farthest away are moving the fastest. The rate of expansion is called Hubble Constant, H0 which currently stands as 74 Kilometers per second per 3 million Kilometers or little less than 2 million miles.


How long this process will go on, there are three scenarios, 1) universe will expand forever, 2) it may come to a balanced state and stop expanding and 3) the expansion is halted and it begins to shrink again to the point where it all started from. There is a tussle between dark energy of the universe and the gravitational pull of the dark matter in it. The dark energy is winning for now and there is a strong consensus among cosmologists that the universe is "flat" (see Shape of the universe) and will continue to expand forever.


How it all began

Expanding universe tells us that at one time it must have been very small. how small? As small as the period at the end of this sentence. With all the energy and matter squeezed in this tiny spot it must have been very hot. Then all of a sudden there was a Big-Bang, the concentrated matter and energy started spreading all around. The energy with no effect of gravity spread evenly (this energy from the early expansion is still with us in the form of Cosmic Microwave Background radiation and is visible through radio telescope), but the force of gravity effected the matter and started to pull matter into clumps that latter formed into galaxies.

picture.jpg

Fig 1.2. Photo source: Hubble Image http://imgsrc.hubblesite.org/hvi/uploads/image_file/image_attachment/6751/full_jpg.jpg

The matter cannot be seen by itself unless it emits light due to energy conversion. The stars we see emit light as a result of nuclear reaction, whereas planets such as earth and moon reflect light that falls on their surface. The oldest light we see is about 12 billion years old coming from the matter that must have moved farthest away after the big bang. This light is in the frequency range of mainly radio waves and X-Rays. These are quasar and considered as the final stage of matters as it evolved from big-bang.

picture.jpg


Fig 1.3. This is a Hubble Space Telescope view of one of the most distant and luminous quasars ever seen (circled in white) and dates to less than one billion years after the big bang. This near-infrared light image was taken with Hubble's Wide Field Camera 3 in December 2010 and January 2011. (Credit: NASA/ESA/M. Mechtley, R. Windhorst, Arizona State University)


picture.jpg

Fig 1.4. This artist's impression of one of the most distant, oldest, brightest quasars ever seen is hidden behind dust. The quasar dates back to less than one billion years after the big bang. The dust is also hiding the view of the underlying galaxy of stars that the quasar is presumably embedded in. (Credit: NASA/ESA/G.Bacon, STScI)
The universe is changing moment to moment, new stars are born and older ones die, it is happening all around us. From our view point on earth these changes are imperceptible, the spread of 74 kilometers/sec for every 3 million kilometers barely puts a dent in the line of sight, but we see this through past light as pages of history reaching us now.

Evolution of Star

Stars are born in galaxies with huge dust clouds and gases called nebulae. Over time, some of the hydrogen gas present in nebulae clump together by the force of gravity and start spinning around. The spinning cloud attracts more surrounding gases and its temperature rises as atoms collide. Millions of years later, the temperature rises up to 15,000,000oC and nuclear fusion begins. This is when the nebulae begin to emit light and a new sun is born which we call a protostar.

picture.jpgpicture.jpgpicture.jpg

Fig 1.5. Dust in Orion Nebula (Phot by NASA)

picture.jpg

Fig 1.6. Formation of Protostar LRLL-54361 (Photo by NASA)

The fate of the star is determined at its birth. The size of the star depends on how much mass it contained at the start of nuclear fusion. For the first few billion years of a star’s life, the continued fusion of hydrogen atoms keeps its light shining brightly.

picture.jpg

Fig 1.7a. Our sun flares up. Photo by NASA.

picture.jpg

Fig 1.7b. X-rays stream off the sun in this image showing observations from NASA's Nuclear Spectroscopic Telescope Array, or NuSTAR, overlaid on a picture taken by NASA's Solar Dynamics Observatory (SDO)


Over time as hydrogen fuel burns, hydrogen changes to helium and as a result star shrinks in size. The core of the star is now mostly helium but the outer shell is still hydrogen. As the core continues to shrink, it heats up the outer shell and expands the surrounding hydrogen. The outer shell cools off as a result of expansion and the star becomes a red giant. Red giants are called red because they emit red light as a result of their cooler temperature.


picture.jpg

Fig 1.8a. Star Camelopardalis a red-giant (Photo by NASA).


picture.jpg

Fig 1.8b. Planetary nebula (NASA Chandra X-Ray Observatory)

As time goes by, hydrogen continues to burn which creates more helium in the core and as such the temperature continues to rise. At 200,000,000o C, the helium atoms fuse together to form carbon atoms. Whatever hydrogen is left forms a ring around the core. The ring is called a planetary nebula.
Without nuclear fusion the star slowly cools off. The last of the helium atoms turn to carbon and the star begins to die. Gravity causes whatever matter is left to collapse inward and the star shrinks. The matter inside the star is very dense but the star is not dead yet because it still emits some white light and is now called a white dwarf. Eventually, all the energy dissipates and the star fades away.


picture.jpg

Fig 1.9. Hubble pinpoints white-dwarf in globular cluster


This is the fate of most small to medium size stars. Our sun is considered a medium size star. But for massive stars that are about six times the size of our sun, their fates change drastically. They start out just like a medium size sun and go through the burning process. However, at the red giant or super giant stage, the force of gravity is so great and the core is so tight that the temperature reaches up to 600,000,000o C. The carbon atoms begin to fuse and form heavier atom such as oxygen and nitrogen. At even higher temperature iron begins to form in the center.

picture.jpg

Fig 1.10. large Magellan cloud, (Photo by NASA).

No further fusion can occur when iron is present in the core, but iron continues to absorb energy and as such the temperature can rise up to 100,000,000,000o C. Finally, the star has too much energy in too small a space and it bursts in a tremendous explosion called a supernova. Seen from the earth, the explosion lights up the sky for weeks and looks like a million suns shining together.

picture.jpg

Fig 1.11. Supernova explosion in the large Magellan cloud (as seen by Hubble telescope).

The explosion sends debris from the star’s core and surrounding gases out into space and a new nebula is formed. The debris also contains heavier elements like gold and platinum, since at this temperature iron atoms starts fusing together and create newer elements. From this new nebula new stars are formed and cycle begins all over again.
If the original mass of the sun was six to thirty times greater than the explosion may leave behind a core called a neutron star that is so dense that its size is few kilometers but as massive as our sun. Neutron star spins rapidly and gives off energy as radio waves. Young neutron stars before they cool can also produce pulses of X-rays when some parts are hotter than others. These are called a pulsar. Below is the picture of Crab Nebula having pulsar in its center.

picture.jpg

Fig 1.12. Crab Nebula (Photo by NASA)
In 2017, scientists detected a collision of two neutron stars as they merge together and gave off gravity waves in the range of 100 Hz. It was good enough to be detected on earth by LIGO (Laser Interferometer Gravitational Wave Observatory) as sound waves. (The gravity wave causes mass to vibrate by expanding and shrinking as oppose to electromagnetic wave that impedes voltage on an antenna.)

Stars over thirty times greater than mass of the sun die in a very strange way. After the supernova explosion the gravity in its core is so great that even light cannot escape. The core is called a black-hole. It can swallow matter and energy like a giant vacuum cleaner and nothing comes out of black hole, not even light, X-rays or any other electromagnetic radiation. These black-holes cannot be observed directly, instead, we infer the presence of black holes and study them by detecting their effect on other matter nearby.

picture.jpg

Fig 1.13. Black-hole in the process of devouring nearby star.
If a black hole passes through a cloud of interstellar matter, it will draw matter inward or if a normal star passes close to a black hole, the black hole can tear the star apart as it pulls it toward itself. As the attracted matter accelerates and heats up, it emits x-rays that radiate into space and is detectable on earth.

picture.jpg

Fig 1.14. Intense X-ray flares thought to be caused by a black hole devouring a star (photo by NASA).
Thus, the universe is a graveyard as well as a nursery of suns. One day our sun will die but there will not be a supernova, its mass is not large enough. It will simply be a red-giant expand to the size that will engulf Jupiter and then collapse into a white-dwarf. For now, we don’t have to worry about it, our sun is still young and have plenty of hydrogen to keep us warm for the next few billion years.


How far a star is from us

Finding the distance of a star is a tricky matter. It is easier to measure the distance of a closer star as there will be an apparent change of its position every six months. The star position hasn’t changed, it is us who went around the sun to the other side and found a different angle. This is called parallax as shown in the Fig. Knowing the angle of observation and the distance of earth from the sun we can apply trigonometric rule to compute the distance of star from the sun. This method is good for stars that are within 100 light-years away from us.


picture.jpg


Fig 1.15. Finding distance of star using parallax.

The other method involves using Spectroscope. A spectroscope can break up the light from a distance star into its characteristic colors. There are milestone stars called Cepheid Variables having a regular cycle of brightness with a frequency related to its luminosity. This was discovered by Henrietta Leavitt (1868 - 1921), while observing stars in Magellan Clouds. All stars in the clouds were at the same distance from earth’s point of view but there was an apparent change in magnitudes of some stars. She inferred that any difference in apparent magnitude was related to a difference in absolute magnitude, and that stars having longer periods were brighter than the shorter-period ones.
Ejner Hertzsprung (1873 – 1967) carried the idea further and showed that a relationship exists between the colors of the stars and their true brightness. He devised a method called spectroscopic parallaxes of stars to estimates their distances from earth. Since the spectrum of a star is a reliable index of its absolute magnitude, its distance can be inferred from the known relationship between the apparent and absolute magnitudes.
The Hertzsprung method was good for stars having distance less than a million light-years. These are the stars within our nearby galaxies. Distance of stars and galaxies further away are derived using a concept called cosmic distance ladder. The idea of the ladder is to start with nearby stars having known distance and calculate the brightness. And then look for similar stars in other galaxies and measure the apparent brightness. Then from the apparent brightness use the knowledge of the real brightness to calculate the distance, and this gives us the distance of the galaxy. Use the brightness of the galaxy to estimate the distance to other similar galaxies, and so on.


How to locate a Star using 3-Dimensional Compass

Stars may be identified by their position in the celestial dome. Think of declination and right ascension as extension of latitude and longitude and pointing to a star from earth is the same as pointing to a different location on earth except the line of sight is extended into the sky.

picture.jpg

Fig 1.22. Local coordinates system.
An observer standing at a known latitude and longitude looking straight ahead, can use the Compass north as a starting point. Looking straight ahead, the horizon is defined as an imaginary circle all around, while zenith is the point straight overhead. The altitude is the angle directly beneath the star on the horizon plane and the azimuth is the angle from geographic north to the point directly beneath star.

picture.jpg

Fig 1.23. Observing star from local coordinate system
It is also helpful to use the angle between zenith and the star called zenith angle as shown in the Fig.
To locate an object in the sky at a specific time, the zenith and azimuth angle with reference to local latitude and longitude must be calculated.

picture.jpg

Fig 1.24. Zenith angle
Suppose, P is the local reference point with known latitude and longitude and Q is the star declination and right ascension with respect to P. The angle between P and Q is the zenith angle as indicated with red color in the Fig.
Extend a line from the center to absolute North (point R) as shown in the Fig. Join P to R and Q to R.

picture.jpg

Fig 1.25. Extending the arch from observer’s point P to north R and star’s location Q to north R.

Using the spherical law of cosines (for a spherical triangle with surface angles P, Q, R opposite sides corresponding to central angles a, b, c)

Zenith angle a = cos-1(cos b cos c + sin b sin c cos (PRQ))

The azimuth angle (RPQ) may be calculated Using the Dot Product Rule (the angle between the two Vectors PR and PQ).
PR ● PQ = PR*PQcosRPQ
azimuth angle ∠PRQ=cos-1PR●PQPR*|PQ|

picture.jpg

Fig 1.26. Vector PR and PQ.

Visit http://starcoordinates.sahraid.com/ for converting celestial coordinates of right ascension and declination into horizon coordinates of zenith and azimuth angle.


3D-Compass

You can make a 3-Dimensional compass with a paper cutout as shown in the Fig. and fold it to make a pointing device to point to an object in the sky.

picture.jpg

Fig 1.27a. 3D Compass cutout

picture.jpg

Fig 1.27b. The declination half and the right ascension half

One-half is the horizontal declination plane and the other half is the vertical Right-Ascension plane. A compass is placed on the edge of the horizontal plane and a pointer on the vertical plane.
Fold the vertical half along the edge over the horizontal plane as shown in the Fig.

picture.jpg

Fig 1.28a. Fold 3D Compass cutout along declination half and right ascension half

picture.jpg

Fig 1.28b. Position the declination plane horizontally, align 0o with compass north, move right ascension pointer to the zenith angle

Hold the 3D-Compass with compass north aligned with 0o declination. Position the right ascension pointer to the star’s zenith angle as shown in Fig. Rotate the compass horizontally till compass north points to the azimuth angle as shown in Fig. The right ascension pointer will point towards the star.

picture.jpg

Fig 1.29a. 3D Compass position right ascension pointer

picture.jpg

Fig 1.29b. 3D Compass rotating to azimuth angle


Table 2. Star Coordinates and 3D Compass Arc angles

picture.jpg


Workshop

Exercise 1
Calculate number of revolutions earth has made since Vernal Equinox of Mar 20, 2000 7:30 AM (GMT) till September, 29, 2:30 AM. (earth takes 23 hours, 56 minutes and 4 second to revolve around its own axis.)
9/20/2017 2:30 AM – 3/20/2000 7:30 = 553622400 seconds.
Earth revolution: 553114800 / 86164 = 6419 20 turns plus 117 degrees.
Exercise 2
Calculate the Arc length  of star Betelgeuse from earth latitude 30o, longitude -91o at the time October, 4, 11:30 PM. (The celestial coordinates of star Betelgeuse are 8o Declination, 88.5o Right Ascension.) The Arc indicates the Right Ascension angle for 3D Compass.

picture.jpg

Fig 1.30. Great circles
Earth has shifted 117o from Celestial coordinates (see Exercise 1).
Reference longitude = -91 + 117 = 26o, Reference latitude = 30o. Point P (30,26).
Star Declination = 8o, Star Right Ascension 88.5o. Point Q (8, 88.5).
Δφ = cos-1(cos(φ1) x cos(φ2) x cos(λ) + sin (φ1) x sin(φ2))
Δφ = cos-1(cos(30) x cos(8) x cos(88.5-26)) + sin (30) x sin(8))
Δφ = 62.5o

Exercise 3
Draw a point facing north equal distance of arc length from reference location (30,26) to star coordinate (8,88,5).

picture.jpg

Fig 1.31. Great circle angles
Simply add the arc length 62.5o (from exercise 2) to the reference latitude.
Point R = ((30 + 62.5), 26) = 92.5o,26o
Exercise 4
Convert polar coordinates of point P, R and Q into rectangular coordinates
Point P (26,30),
Px = cos(30)x(cos(26) = 0.78, Py=cos(30)xSin(30) = 0.38, Pz = Sin(30) = 0.5.
Point Q (8,88.5),
Qx = cos(8)x(cos(88.5) = 0.026, Qy=cos(8)xSin(88.5) = 0.99, Qz = Sin(8) = 0.14.
Point R (92.5,30),
Rx = cos(8)x(cos(88.5) = -0.04, Ry=cos(8)xSin(88.5) = -0.017, Rz = Sin(8) = 0.99

Exercise 5
Convert to Vector PR (point P and point R) and convert to Vector PQ (Point P and point Q)

picture.jpg

Fig 1.31. Vector PR and PQ
X = Rx – Px Y= Ry- Py, Z = Rz - Pz
X = -0.04 – 0.78 = -0.81, Y = -0.017 – 0.38 = -0.4 Z = 0.5
Vector PQ
X = Qx – Px Y= Qy- Py, Z = Qz - Pz
X = 0.026 – 0.78 = -0.75, Y = 0.99 – 0.38 = 0.61 Z = -0.36

Exercise 4
Compute Vector magnitude PR and PQ.
Magnitude of Vector PR = x2+y2+z2=-0.812+-0.42+0.52=1.03
Magnitude of Vector PQ = x2+y2+z2=-0.752+0.612+-0.362=1.03
Exercise 5
Compute dot product of the Vector PR and PQ.

DotProduct = PR●PQ = PRx*PQx+PRy*PQy+PRz*PQz =
PR●PQ = -0.81*-0.75+0.4*0.61+0.5* -0.36=0.19

Exercise 5
Compute angle  between the Vector PR and PQ.

picture.jpg

Fig 1.32. Angle between vectors
α=cos-1dot productmagnitude A*Magnitude B
α=cos-10.191.03*1.03=80 degree


Trigonometric Ratios

Trigonometry is the study of triangles, their measurements, and calculations based on these measurements. The right triangle has a special place in trigonometry because of its interesting characteristics. As previously proven, in a right triangle, the square of the length of the hypotenuse is equal to the sum of the squares of its sides. This leads to some special ratios like sine and cosine, which are used extensively in such fields as science, engineering, and architecture.

picture.jpg

Trig Functions

Sine: In a right triangle, the ratio of the length of the opposite side to its hypotenuse (for a given angle θ or theta) is a constant and is called sinθ or the sine of the angle θ. Its inverse trig function is cosecant, denoted cscθ.
sinθ=Opposite/Hypotenuse cscθ=1/sinθ=Hypotenuse/Opposite
Ex: The sine of an angle in a right triangle can also be a measure of steepness. Imagine a road that uniformly rises 6 feet in height for every 100 ft in length, as shown below. The steepness of the road is then 6/100. Coincidentally, the measure of steepness is important in road construction; any value greater than 6/100 is usually avoided for safety reasons.

picture.jpg


Cosine: In a right triangle, the ratio of the length of its adjacent side or base to its hypotenuse is a constant for any angle θ, and is called cosθ or the cosine of the angle θ. Its inverse trig function is secant, denoted secθ.
cosθ=Adjacent/Hypotenuse secθ=1/cosθ=Hypotenuse/Adjacent
Tangent: In a right triangle, the ratio of the length of its opposite side to its adjacent side or base is a constant for any angle θ, and is called tanθ or the tangent of the angle θ. Its inverse trig function is cotangent, denoted cotθ.
tanθ=Opposite/Adjacent cotθ=1/tanθ=Adjacent/Opposite

Inverse Trig Functions

picture.jpg

Sine, cosine, and tangent give the ratios of sides in a right triangle for a given angle. But what if you know the ratio and want to find the measure of the angle? Inverse trigonometric functions solve this problem by giving an angle in a right triangle from a given ratio.
Arcsine: Arcsine gives the angle θ given the sine ratio. It is denoted arcsinx or sin-1x. In other words, when the ratio of the opposite side to the hypotenuse is given, the corresponding measure of ∠A (in the figure) is given by the arcsine of the opposite over the hypotenuse.

sinθ=OppositeHypotenuse θ=sin-1OppositeHypotenuse


Arccosine: Arccosine gives the angle θ given the cosine ratio. It is denoted arccosx or cos-1x. In other words, when the ratio of the adjacent side to the hypotenuse is given, the corresponding measure of ∠A (in the figure) is given by the arccosine of the adjacent side to the base.
cosθ=AdjacentHypotenuse θ=cos-1AdjacentHypotenuse
Arctangent: Arctangent gives the angle θ given the cosine ratio. It is denoted arccosx or cos-1x. In other words, when the ratio of the opposite side to the adjacent side is given, the corresponding measure of ∠A is given by the arccosine of the opposite side to the adjacent side.
tanθ=Opposite/Adjacent θ=tan-1OppositeAdjacent

Complimentary Relationships of Trig Ratios

In a right triangle, the two angles opposite to the base and the perpendicular are complimentary. For example, in Fig 1.2.1, the angles α and β satisfy α+β=90°=π2 radians.

picture.jpg


Fig 1.2.1: Angles α and β are complementary
The nature of the trigonometric functions implies that the following statements are true:
cosα=sinπ2-α=sinβ
cscα=secπ2-α=secβ
cotα=tanπ2-α=tanβ

The Unit Circle

picture.jpg

A perpendicular drawn from the perimeter of a circle of radius 1 to the x-axis makes a right triangle, as shown in Fig 2.1. This circle is known as the unit circle. From this triangle, squares of trigonometric ratios can be obtained using the Pythagorean Theorem.

Fig 2.1 Squares of the sides of a right triangle formed on the unit circle.

With reference to Fig 2.1, we can simplify the trigonometric ratios by substituting 1 (the radius of the circle) as the length of the hypotenuse.
sinθ=Opposite=a
cosθ=Base=b
Using the Pythagorean Theorem, we can obtain the following important identities:
sin2θ+cos2θ=1
sin2θ=1-cos2θ or sinθ=1-cos2θ
cos2θ=1-sin2θ or cosθ=1-sin2θ
tanθ=sinθcosθ


Worksheet: Computing Sine and Cosine Using a Circle

picture.jpg


While scientific calculators are able to determine sine and cosine automatically, it’s also possible to compute the ratio graphically from the triangles formed in Fig 1.2.3. Fill out the entries in the table to compute the sine and cosine of various values, and verify these values with a calculator.
Note: The hypotenuse in all of the triangles is 40 units, and the quarter circle (90°) is divided into 10 angles. a=opposite, b=adjacent, and c=hypotenuse.

Fig 2.2. Graphical determination of sine and cosine

Trig Ruler

picture.jpg

A trigonometric ruler can be constructed that shows the values of the trigonometric functions without the use of a calculator. The ruler consists of three scales, labeled Hypotenuse, Base, and Perpendicular, and a circular disc measuring angles around a circle from 0° to 360°, as shown in Fig 1.2.4. The length of each scale is 1 unit, but it is also divided into 100 smaller units.
To assemble the trig ruler, cut out the scales and the circular disc and attach as shown in Fig 1.2.5. (Note: the perpendicular is suspended from the other end of the hypotenuse.)

Fig 2.3. Trig Ruler scales and circular disc

picture.jpg


Fig 2.4. Trig Ruler assembly


Using the Trig Ruler


You can calculate the height of an object (such as a building or a tree) and its distance from you with the help of the Trig Ruler by simply measuring the angle of your line of sight.
To find out how far away an object is, stand at a distance and align the Trig Ruler such that the base is horizontal and parallel to the ground and the hypotenuse is aligned toward the bottom of the object, as shown in Fig 1.2.6. By doing this, you are creating two similar triangles. Using the fact that the sides of similar triangles are proportional, you can find the object’s distance x from you.

picture.jpg

Note: You are looking at the object from your height, so the height h is same as your height. The height h' is the reading from the Trig Ruler’s Perpendicular scale and the distance x’ is the reading from the Trig Ruler’s Base scale (where the Base and the Perpendicular intersect). x is the distance from the object to you.

This gives you your distance from the object, x, as: Fig 2.5. Using the Trig Ruler to measure distances
x/h=x'/h'
The height H of the object can be calculated by aligning the hypotenuse toward the top of the object and measuring the Trig Ruler’s Base and Perpendicular scales at the point where they intersect. If the base scale measures x and the perpendicular scale measures h, then the height of the object can be found by using:

picture.jpg

H/h=X/x

Fig 2.6. Using the Trig Ruler to find the height of an object


Elliptic Leveler

Measuring the slope of a surface is important when constructing geometric figures. A bubble leveler is generally used to determine whether a surface is level or not: a bubble in a liquid-filled tube rests in the middle of the tube only if the surface it is sitting on is absolutely horizontal. However, on a slanted surface, the bubble moves away from the center. This kind of leveler has limited use, as it cannot tell the angle of the slant. When the shape of the leveler is elliptic, marks can be placed along the curved surface to show the angle of the slant, such as the elliptic leveler shown in Fig.

picture.jpg

Fig 3.1. An Elliptic Leveler showing the position of the bubble on a horizontal surface
Although a tube shaped as any type of curve, the elliptic shape is ideal, as it allows for more divisions near the 0° mark and less as the angle measure increases.


picture.jpg


Fig 3.2. An Elliptic Leveler showing a 10° inclination


picture.jpg

Fig 3.3. The drop in the height of an elliptic curve with minor radius 1.5” and major radius 6” is shown; the drop is measured at every 5° of inclination